The CLR Profiler
provides various types of reports which help in determining the performance of
the application and tuning it. The “Histogram
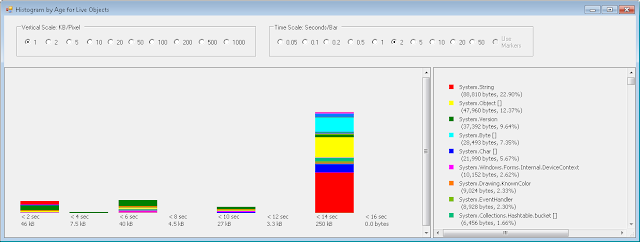
by Age” report shows the object allocating aging report which shows the
object allocation across time intervals.
To view the “Histogram by Age” report, use the following steps.
1. Start CLR Profiler (CLRProfiler.exe)
2. Make sure that the following check boxes are selected:
Profiling active
Allocations
Calls
To view the “Histogram by Age” report, use the following steps.
1. Start CLR Profiler (CLRProfiler.exe)
2. Make sure that the following check boxes are selected:
Profiling active
Allocations
Calls
3. Click Start Application (or) Select File -> Profile Application
4. In the File dialog which opens, select the applications .Exe file and click Open
5. This will open the application, work on the application and finally close the application
6. Once the application exits, the Profiler summary screen will open, close this summary dialog.
7. Click on View -> Histogram by Age option to open the Report
The following screen shows on how the “Histogram by Age” report details will be displayed for a simple Windows Application.

The objects are classified based on the time when they were initialized and allocated. The first bar shows the following
<2 -="" 2="" after="" application="" br="" first="" initialized="" nbsp="" objects="" seconds="" secs="" started="" the="" these="" were="" within=""> 46 KB - The total size of all the objects which were initialized in the first 2 seconds.
Similarly you can interpret the other bars to understand the number and size of objects which were allocated throughout the life cycle of the Application. The panel at the right shows the various objects which were created and allocated based on the type of the object.


No comments:
Post a Comment