The
PerfView is a performance analysis
tool from Microsoft, the tool can be used to analyze application performance of
both Windows and Web based applications. In this post we shall see on how to
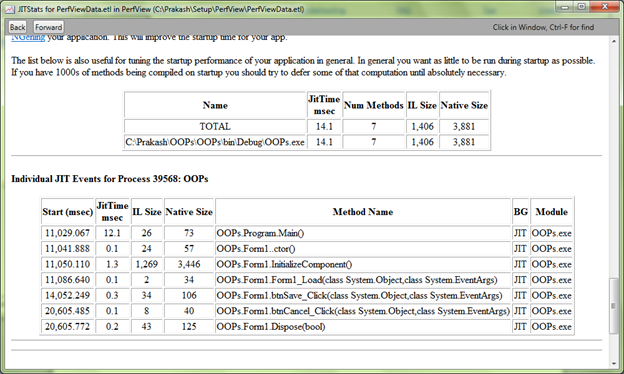
analyze the data about the runtime JIT compiler, to determine the code and
utilization of the application. This report provides details about the size of
the JIT and Native code for every function / method in the application. This
will help us to determine any oversized methods and fix it by breaking them
appropriately.
To analyze the JIT Status of an application follow the below steps.
1. Open PerfView.exe
2. Select Collect -> Collect
3. Leave all the settings as it is and click on the Start Collection button.
4. Open the application which you want to profile.
5. Work on the application and close it.
6. Back in the PerfView interface click on the Stop Collect button.
7. PerfView will analyze the trace information and display the reports in the left side tree as follows.
8. Double
Click on the JIT Status node in the tree.
9. This will open up a pop-up with the list of all the processes which were analyzed.
10. Identify your application / process and double click on the process
11. This will open up another pop-up window with details of the JIT Status as follows.
9. This will open up a pop-up with the list of all the processes which were analyzed.
10. Identify your application / process and double click on the process
11. This will open up another pop-up window with details of the JIT Status as follows.


No comments:
Post a Comment