The CLR Profiler can be used to
profiler your windows / web application. The CLR Profiler provides useful
inputs in how the application is executed in the underlying runtime
environment.
Before you profile your application using the CLR Profiler make sure that you are using the correct version of the CLR Profiler which matches with the version of the framework which was used to develop the application. Also make sure to select the format of the CLP Profiler 32/64 bit based on how you developed your application.
Once you selected the correct CLR Profiler, use the following steps to profile your web application.
Start CLR Profiler.Before you profile your application using the CLR Profiler make sure that you are using the correct version of the CLR Profiler which matches with the version of the framework which was used to develop the application. Also make sure to select the format of the CLP Profiler 32/64 bit based on how you developed your application.
Once you selected the correct CLR Profiler, use the following steps to profile your web application.
1.
Make sure that the following check boxes are selected:
o
Profiling active
o
Allocations
o
Calls
2.
On the File menu, click Profile ASP.NET.
CLR Profiler
shuts down Internet Information Services (IIS), adds environment variables that
are needed for profiling, and restarts IIS. CLR Profiler then prompts you to
load the ASP.NET application and waits for the ASP.NET worker process to start.
3.
Use Microsoft Internet Explorer to browse to the ASP.NET
application you want to profile.
You can also
run your Web application by using a client tool such as Microsoft Application
Center Test (ACT.)
4.
When you have finished running the application, click Kill
ASP.NET in the CLR Profiler main window.
CLR Profiler
shuts down IIS, removes the environment variables, and restarts IIS.
Once the profiler is stopped, it will automatically
display the Summary Report.
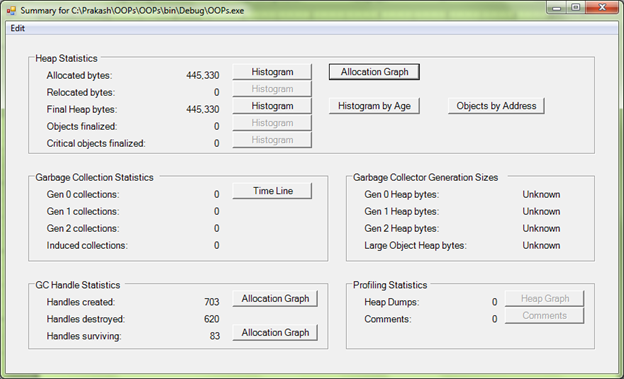
The following screen shows on how the summary details will be displayed for a simple Web Application.
The following screen shows on how the summary details will be displayed for a simple Web Application.


No comments:
Post a Comment